Weather forecast Nida Nov 2, 2026

10°7° · Patchy rain possible

Weather forecast Nida Monday Nov 2, 2026: patchy rain possible, temperature from 7 °C to 10 °C.

Precipitation probability 30%. Wind up to 3.31 m/s (gusts 5.22 m/s). Air humidity 70–81%, atmospheric pressure 771–773 mm Hg, UV index up to 0.5.

5 days at a glance — tap a day to open it
Sunrise 07:45
Sunset 16:53
Last Quarter40% illuminated
Moonrise 23:32 · Moonset 14:47
Chart
Table

Forecast from 7 °C to 10 °C and precipitation

Temperature & Precipitation
Time00:0001:0002:0003:0004:0005:0006:0007:0008:0009:0010:0011:0012:0013:0014:0015:0016:0017:0018:0019:0020:0021:0022:0023:00
Temperature (°C)887887887888101091010910109101010
Precipitation (mm/hr)0000000000000.020.060.080.110.080.070.030.040.010.010.010.01

Cloud cover and precipitation probability

Cloud cover & Rain chance
Time00:0001:0002:0003:0004:0005:0006:0007:0008:0009:0010:0011:0012:0013:0014:0015:0016:0017:0018:0019:0020:0021:0022:0023:00
Cloud cover (%)5662646255422736578677949810097829993100100100
Rain chance (%)991699168814101113181925272530182322212120

Wind speed and direction

Wind & Wind gust
Time00:0001:0002:0003:0004:0005:0006:0007:0008:0009:0010:0011:0012:0013:0014:0015:0016:0017:0018:0019:0020:0021:0022:0023:00
Wind (m/s)2.392.52.52.812.692.392.612.52.692.692.893.193.313.312.892.52.111.611.311.110.690.811.52
Wind gust (m/s)2.893.114.223.613.614.173.53.334.393.193.615.223.813.534.3932.613.171.891.811.941.812.222.92
Wind direction (°)S 183°S 185°SSE 160°S 187°S 191°SSE 163°SSW 193°S 186°SSE 157°SSE 165°SSE 163°SSE 165°S 180°S 190°SSW 198°SW 216°SW 230°WSW 240°W 262°WNW 302°W 260°NNW 331°NNW 327°WNW 292°

Air humidity

Humidity
Time00:0001:0002:0003:0004:0005:0006:0007:0008:0009:0010:0011:0012:0013:0014:0015:0016:0017:0018:0019:0020:0021:0022:0023:00
Humidity (%)787880787879777681777573717073707080717277727372

Atmospheric pressure

Pressure
Time00:0001:0002:0003:0004:0005:0006:0007:0008:0009:0010:0011:0012:0013:0014:0015:0016:0017:0018:0019:0020:0021:0022:0023:00
Pressure (mm Hg)772772773772771772771771772771772772772772772772772772772773772773773772

Ultraviolet index

UV Index
Time00:0001:0002:0003:0004:0005:0006:0007:0008:0009:0010:0011:0012:0013:0014:0015:0016:0017:0018:0019:0020:0021:0022:0023:00
UV Index00000000000.30.40.50.40.30.20.10000000

Air quality & pollen

Air quality
Time00:0001:0002:0003:0004:0005:0006:0007:0008:0009:0010:0011:0012:0013:0014:0015:0016:0017:0018:0019:0020:0021:0022:0023:00
PM2.5 (µg/m³)3.33.43.3333.22.92.72.42.31.81.72.22.52.433.23.43.84.65.45.14.53.3
PM10 (µg/m³)4.34.24.24.44.53.93.73.23.132.92.92.933.23.33.844.85.16.15.55.14.1
Ozone (O₃) (µg/m³)474546474644464850495050515050505047464542404145
NO₂ (µg/m³)1.81.822.22.42.42.22.32.42.93.13.43.43.63.744.55.35.14.84.75.95.94.6
SO₂ (µg/m³)0.10.10.10.10.10.10.10.10.10.10.10.30.60.50.82.9912.810.97.54.82.71.91.2
CO (µg/m³)162161160159162159158158156155155155155155156158160162160160161161158153

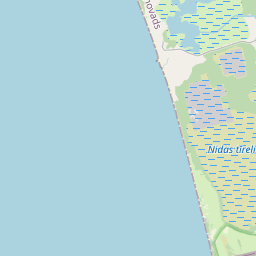
Nida on the map

Data Sources & Methodology

Our weather forecasts are powered by a professional weather data provider that aggregates data from national weather services, satellite observations, radar networks, and over 80,000 weather stations worldwide. Forecast data is updated multiple times daily. We convert raw data into clear summaries — wind speed in m/s, pressure in mmHg — so you can plan your day with confidence.

Top.LV