Weather forecast Alsunga Nov 2, 2026

10°6° · Patchy rain possible

Weather forecast Alsunga Monday Nov 2, 2026: patchy rain possible, temperature from 6 °C to 10 °C.

Precipitation probability 34%. Wind up to 4.5 m/s (gusts 6.03 m/s). Air humidity 69–91%, atmospheric pressure 771–772 mm Hg, UV index up to 0.6.

5 days at a glance — tap a day to open it
Sunrise 07:46
Sunset 16:47
Last Quarter40% illuminated
Moonrise 23:26 · Moonset 14:49
Chart
Table

Forecast from 6 °C to 10 °C and precipitation

Temperature & Precipitation
Time00:0001:0002:0003:0004:0005:0006:0007:0008:0009:0010:0011:0012:0013:0014:0015:0016:0017:0018:0019:0020:0021:0022:0023:00
Temperature (°C)886886886998999101091010910109
Precipitation (mm/hr)0.020.040.030.060.050.020.070.060.030.090.060.050.060.090.070.080.020.0300.010.070.010.010.06

Cloud cover and precipitation probability

Cloud cover & Rain chance
Time00:0001:0002:0003:0004:0005:0006:0007:0008:0009:0010:0011:0012:0013:0014:0015:0016:0017:0018:0019:0020:0021:0022:0023:00
Cloud cover (%)60687910010064100100711001007899999099100100100100100100100100
Rain chance (%)192328323124333227343225303026252026181932212233

Wind speed and direction

Wind & Wind gust
Time00:0001:0002:0003:0004:0005:0006:0007:0008:0009:0010:0011:0012:0013:0014:0015:0016:0017:0018:0019:0020:0021:0022:0023:00
Wind (m/s)3.8943.613.894.194.194.394.394.314.394.54.114.313.612.892.392.111.611.691.8122.693.612.61
Wind gust (m/s)4.114.395.314.314.425.944.814.816.034.814.816.034.924.195.253.142.613.532.422.53.813.314.114.47
Wind direction (°)S 185°S 189°S 174°S 184°S 179°S 174°S 179°S 180°S 172°S 178°S 172°S 175°S 182°SSW 194°SSW 207°SW 235°WSW 247°SW 214°WSW 248°WSW 248°SW 232°W 280°W 281°W 264°

Air humidity

Humidity
Time00:0001:0002:0003:0004:0005:0006:0007:0008:0009:0010:0011:0012:0013:0014:0015:0016:0017:0018:0019:0020:0021:0022:0023:00
Humidity (%)848491848490848491838284807777707080696982737585

Atmospheric pressure

Pressure
Time00:0001:0002:0003:0004:0005:0006:0007:0008:0009:0010:0011:0012:0013:0014:0015:0016:0017:0018:0019:0020:0021:0022:0023:00
Pressure (mm Hg)772772772772771772771771771771771772771771772771771771771772771772772771

Ultraviolet index

UV Index
Time00:0001:0002:0003:0004:0005:0006:0007:0008:0009:0010:0011:0012:0013:0014:0015:0016:0017:0018:0019:0020:0021:0022:0023:00
UV Index00000000000.30.50.60.60.50.30.10000000

Air quality & pollen

Air quality
Time00:0001:0002:0003:0004:0005:0006:0007:0008:0009:0010:0011:0012:0013:0014:0015:0016:0017:0018:0019:0020:0021:0022:0023:00
PM2.5 (µg/m³)5.44.73.32.62.62.72.52.42.72.62.42.62.22.22.12.21.91.81.81.91.71.41.51.4
PM10 (µg/m³)6.25.33.93.23.13.33.43.63.53.43.13.43.63.63.63.53.5333.12.92.63.22.7
Ozone (O₃) (µg/m³)454749504846444341424748495051494752545453525457
NO₂ (µg/m³)2.521.51.41.51.61.7222.12.22.32.32.32.42.62.62.41.91.61.51.41.11.1
SO₂ (µg/m³)0.20.20.10.10.10.10.10.10.10.10.10.20.20.20.20.20.20.10.10.10.1000
CO (µg/m³)170163160159159157157156157157157157156154152152151151151150147148146144

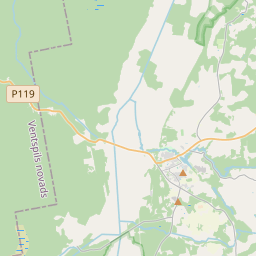
Alsunga on the map

Data Sources & Methodology

Our weather forecasts are powered by a professional weather data provider that aggregates data from national weather services, satellite observations, radar networks, and over 80,000 weather stations worldwide. Forecast data is updated multiple times daily. We convert raw data into clear summaries — wind speed in m/s, pressure in mmHg — so you can plan your day with confidence.

Top.LV