Weather forecast Saldus Nov 2, 2026

9°2° · Sunny

Weather forecast Saldus tomorrow Nov 2, 2026: sunny, temperature from 2 °C to 9 °C.

Precipitation probability 42%. Wind up to 1.81 m/s (gusts 6.39 m/s). Air humidity 66–97%, atmospheric pressure 772–773 mm Hg, UV index up to 0.7.

5 days at a glance — tap a day to open it
Sunrise 07:41
Sunset 16:45
Last Quarter40% illuminated
Moonrise 23:23 · Moonset 14:44
Chart
Table

Forecast from 2 °C to 9 °C and precipitation

Temperature & Precipitation
Time00:0001:0002:0003:0004:0005:0006:0007:0008:0009:0010:0011:0012:0013:0014:0015:0016:0017:0018:0019:0020:0021:0022:0023:00
Temperature (°C)332332223356898875665665
Precipitation (mm/hr)000000000000000000000000

Cloud cover and precipitation probability

Cloud cover & Rain chance
Time00:0001:0002:0003:0004:0005:0006:0007:0008:0009:0010:0011:0012:0013:0014:0015:0016:0017:0018:0019:0020:0021:0022:0023:00
Cloud cover (%)5410000595535554856496097551001008610010095
Rain chance (%)151542151529151519131015659112117232425242529

Wind speed and direction

Wind & Wind gust
Time00:0001:0002:0003:0004:0005:0006:0007:0008:0009:0010:0011:0012:0013:0014:0015:0016:0017:0018:0019:0020:0021:0022:0023:00
Wind (m/s)1.391.51.51.51.391.611.311.311.51.191.111.391.3111.610.691.111.51.191.51.811.391.51.69
Wind gust (m/s)1.391.532.191.56.392.751.311.312.424.191.3135.3163.310.921.112.141.191.532.751.421.612.69
Wind direction (°)SSW 202°SSW 206°SSW 193°SSW 212°SW 218°S 186°SSW 201°SSW 196°SSE 162°S 180°SSE 167°S 182°SSE 157°SSE 164°SSW 194°S 187°S 180°SSW 194°S 187°S 184°SW 216°SW 224°WSW 245°SW 218°

Air humidity

Humidity
Time00:0001:0002:0003:0004:0005:0006:0007:0008:0009:0010:0011:0012:0013:0014:0015:0016:0017:0018:0019:0020:0021:0022:0023:00
Humidity (%)939497949497939394888081696668687583797987808190

Atmospheric pressure

Pressure
Time00:0001:0002:0003:0004:0005:0006:0007:0008:0009:0010:0011:0012:0013:0014:0015:0016:0017:0018:0019:0020:0021:0022:0023:00
Pressure (mm Hg)773773773773773773772772772773773773773773772772772772773773773773773773

Ultraviolet index

UV Index
Time00:0001:0002:0003:0004:0005:0006:0007:0008:0009:0010:0011:0012:0013:0014:0015:0016:0017:0018:0019:0020:0021:0022:0023:00
UV Index0000000000.10.30.50.70.70.50.20.10000000

Air quality & pollen

Air quality
Time00:0001:0002:0003:0004:0005:0006:0007:0008:0009:0010:0011:0012:0013:0014:0015:0016:0017:0018:0019:0020:0021:0022:0023:00
PM2.5 (µg/m³)7.57.377.18.48.98.89.310.19.28.46.45.25.15.15.55.65.96.36.77.38.28.48.2
PM10 (µg/m³)9.28.388.710.110.610.511.111.411.19.98.476.87.47.67.47.67.88.28.69.89.99.7
Ozone (O₃) (µg/m³)293028272828252322222436414344434238343230323030
NO₂ (µg/m³)10.18.76.76.9910.19.51012.313.113.111.810.110.89.78.79.19.59.59.59.28.17.77.5
SO₂ (µg/m³)0.50.6126.713.712.810.79.77.36.36.45.154.83.744.643.42.72.12.22.6
CO (µg/m³)178176175175176176173177179181184180177174171171170174177183185187187181

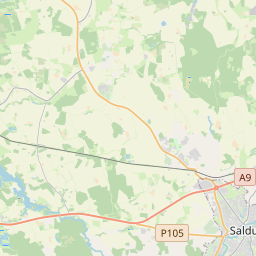
Saldus on the map

Data Sources & Methodology

Our weather forecasts are powered by a professional weather data provider that aggregates data from national weather services, satellite observations, radar networks, and over 80,000 weather stations worldwide. Forecast data is updated multiple times daily. We convert raw data into clear summaries — wind speed in m/s, pressure in mmHg — so you can plan your day with confidence.

Top.LV